I like open source. Specifically, I like github. Mostly because if something annoys me in code, I can fork, change, then pull from my branch in the future (how I handle TQDM). Or clone, update locally, and pull changes, dealing with conflicts in the future (how I handle oh-my-zsh). Either way, I can make my changes persist somehow.
The reason I bring this up, is because I wanted to test my code against the RDPlot package. I threw my data at it and it worked just fine, until I tried to do area confidence limits. Because the RDPlot code uses xline, Stata lays that down as part of the axis, which the area plot then covers. So there's no vertical line at the RD cutoff in the middle of the graph. This will just not do. So I opened the code, and added the following (on line 646 if you're interested, changes bolded). Now it looks as I desire, but I can't make this persist across updates. Nor can I submit a bug report or a pull request. If only it were on github :(. C'est la vie, it works for now.
quietly sum cir_bin, d
local plot_y_max = r(max)
quietly sum cil_bin, d
local plot_y_min = r(min)
twoway (rarea cil_bin cir_bin meanx_bin, sort color(gs11)) ///
(scatter meany_bin meanx_bin, sort msize(small) mcolor(gs10)) ///
(line y_hat x_sup if x_sup<`c', lcolor(black) sort lwidth(medthin) lpattern(solid)) /// (line y_hat x_sup if x_sup>=`c', lcolor(black) sort lwidth(medthin) lpattern(solid)) ///
(pci `plot_y_max' `c' `plot_y_min' `c', lcolor(black) lwidth(medthin) legend(off)), ///
xline(`c', lcolor(black) lwidth(medthin)) xscale(r(`x_min' `x_max')) legend(cols(2) order(2 "Sample average within bin" 3 "Polynomial fit of order `p'" )) `graph_options'
Thursday, November 3, 2016
Thursday, June 9, 2016
Ipython parallel local vs. engine execution
TL;DR: using a lambda in the map on a ipyparallel View will obviate loading the function locally.
I've always used %%px --local to do parallel processing in Python. But recently I wanted to throw all my code in a python file, then just have a short notebook that essentially just kicked off the processes and wrote the results to disk. So I tried this:
I've always used %%px --local to do parallel processing in Python. But recently I wanted to throw all my code in a python file, then just have a short notebook that essentially just kicked off the processes and wrote the results to disk. So I tried this:
#In [1]:However this doesn't work. The reason is the IP_view.map; it's looking for analyze_multiple_ciks locally, which we haven't loaded. So wrapping that function to defer its referencing seems to work:
from ipyparallel import Client
IP_client = Client()
IP_view = IP_client.load_balanced_view()
# In [2]:
%%px
import sys
sys.path.append('.../code/')
from myresearch import analyze_multiple_ciks
#In [3]:
N = len(IP_client.ids) # or larger for load balancing
_gs = [df[(df.cik > (_d.cik.quantile(i/N) if i else 0))
&(df.cik <= df.cik.quantile((i+1)/N))]
for i in range(N)]
#In [4]:
res = IP_view.map(analyze_multiple_ciks, _gs)
#In [4]:Perhaps this was obvious, but I couldn't find much online about it. Also I do the chunking manually in In[3] because I've found using ipython to queue 23,000 tasks is really slow. So I wrap my code in an 'analyze_multiple' function and reduce the queue length considerably. Maybe that's not still a problem in the updated ipyparallel, but it's how I've always done it.
res = IP_view.map(lambda x: analyze_multiple_ciks(x), _gs)
Tuesday, April 5, 2016
Clustered Standard Errors in Statsmodel OLS
I am using Statsmodel instead of STATA where possible, and wanted to cluster standard errors by firm. The problem I encountered was I use Patsy to create the endog/exog matrices, and statsmodel requires the cluster group Series to match length. (Aside: There's an open Github issue about this.) I'm sure there are more clever solutions, but mine was to give Patsy a dataframe with no missing data. The statsmodels documentation was a bit unclear, so I figured I'd share the working snippet below.
# Selection criteria
select_df = (df[(df['at']>1) & (df['ff12']!=8)]
.sort_values('cik y_q'.split()))
# Columns that appear in regressions, as well as group variable
cols = 'cik cp ni_at re_at xrd_at at y_q ff12'.split()
# Final dataframe with no missing data.
# This gets the patsy arrays and group series to have the same length.
reg_df = select_df.ix[select_df[cols].notnull().all(axis=1), cols]
mod = sm.OLS.from_formula('cp ~ ni_at + re_at + xrd_at + np.log(at)'
'+ C(y_q) + C(ff12)', reg_df)
res = mod.fit(cov_type='cluster', cov_kwds={'groups': reg_df['cik']})
# output results without F.E. dummies
print("\n".join([x for x in str(res.summary()).split('\n')
if 'C(' not in x]))
Tuesday, February 16, 2016
Fama French Industries
I'm back in Python and needing to get FF12 from sic codes. So I wrote a little script to download the definitions from French's website and make a Pandas DataFrame that allows for merging. Thought I would share:
Edit: An alternative is to use pandas_datareader.famafrench
Edit: An alternative is to use pandas_datareader.famafrench
Monday, February 1, 2016
SAS on XUbuntu
For a long time I only had SAS running in -nodms mode on the latest XUbuntu, my desktop's OS. Today I finally figured it out, and wanted to share just in case anyone else has had this problem.
First off, I'm running Xubuntu Wily (15.10), and SAS 9.4. The installation didn't work in graphical mode, because when I sudo su sas, then ./sasdm.sh, it complains: Can't connect to X11 window server using ':0' as the value of the DISPLAY variable. Whatever, ./sasdm.sh -console works. Anyway, the first problem when launching SAS is that it complained about the SASHELP Portable Registry being corrupted. Turns out it didn't exist at all. So I had to copy regstry.sas7bitm from a working version of SAS 9.3 (yeah, it worked across versions somehow) to my local sascfg directory (/opt/SASHome/SASFoundation/9.4/nls/en/sascfg/). Once that was there, I started getting errors about missing libraries. First libXp.so.6, which doesn't exist on the Wily repo any more, and must be downloaded from the Vivid repo here:
http://packages.ubuntu.com/vivid/amd64/libxp6/download
And secondly libjpeg.so.62, which can be installed with sudo apt-get install libjpeg62-dev libjpeg62. Finally once that was done, SAS loaded in dms mode. It also now runs in X11 mode forwarded over ssh now too.
Thursday, November 12, 2015
SAS on Jupyter
I strongly prefer to do all my coding from within Jupyter notebooks, but that's not really possible when everyone else uses SAS (well, in Accounting). So I threw together a really simple SAS kernel for Jupyter, which is hosted on github (gaulinmp/sas_kernel). It'd definitely a work in progress, right now it doesn't even strip line numbers. But my free time is limited, what with dissertating and all. While I'm at it, I'll also plug my SEC EDGAR python library, which I use a lot these days.
Tuesday, May 20, 2014
Helpful SAS UI/usage tips
TL;DR: http://support.sas.com/resources/papers/proceedings12/151-2012.pdf
After a long time reading and too little time in Python, I'm back to SAS. My setup involves sshing into a linux server and using SAS over X11 because I like to look at tables. I know there is SAS interactive mode, but I'm a Luddite or don't want to incur the learning costs.
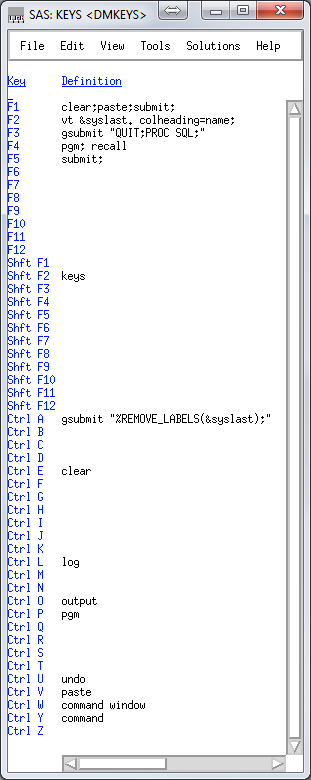 Right now my keys file looks like this:
clear;paste;submit; is what I use most often. I program in SublimeText3, and copy sections of code, alt-tab over and hit F1.
vt &syslast. colheading=name; uses the VIEWTABLE (vt) command to open a table for viewing, and &syslast is an automatic variable that stores the last edited table. This is a 'what did I just make' button.
gsubmit "QUIT;PROC SQL;" is convenient because I do almost everything in PROC SQL, which I like to just leave running. But when I jump out quickly, this gets me back in so I don't have to copy and paste the proc start command.
gsubmit "%REMOVE_LABELS(&syslast);" runs a macro that removes the labels from the last file edited. This is not really that important, I just don't like labels in my datasets.
The REMOVE_LABELS macro can be found in my MACROS.SAS gist.
Also to automatically display variable names in the column headings of tables, see here.
After a long time reading and too little time in Python, I'm back to SAS. My setup involves sshing into a linux server and using SAS over X11 because I like to look at tables. I know there is SAS interactive mode, but I'm a Luddite or don't want to incur the learning costs.
Right now my keys file looks like this:clear;paste;submit; is what I use most often. I program in SublimeText3, and copy sections of code, alt-tab over and hit F1.
vt &syslast. colheading=name; uses the VIEWTABLE (vt) command to open a table for viewing, and &syslast is an automatic variable that stores the last edited table. This is a 'what did I just make' button.
gsubmit "QUIT;PROC SQL;" is convenient because I do almost everything in PROC SQL, which I like to just leave running. But when I jump out quickly, this gets me back in so I don't have to copy and paste the proc start command.
gsubmit "%REMOVE_LABELS(&syslast);" runs a macro that removes the labels from the last file edited. This is not really that important, I just don't like labels in my datasets.
The REMOVE_LABELS macro can be found in my MACROS.SAS gist.
Also to automatically display variable names in the column headings of tables, see here.
Subscribe to:
Posts (Atom)